SynthSAR ConfirmationThis indicator represents confirmation of a trend based on the PSAR indicator and includes signals from the MACD, stochastic oscillator, and awesome oscillator. It displays the points of the parabolic SAR on the chart, which help determine the direction of the trend. Additionally, the indicator allows for tracking signals based on the combined analysis of three other technical indicators: MACD, stochastic oscillator, and awesome oscillator. Furthermore, the indicator includes the ability to display buy/sell labels and signals for changing the trend direction. This is not an investment recommendation.Very effective in higher timeframes.If the MACD "macd line" crosses the "signal line" from above and the Stochastic %K line crosses the %D line from above, and the last column in the Avesome Oscillator is red, then the indicator gives a signal to sell. If the MACD "macd line" crosses the "signal line" from below and the Stochastic %K line crosses the %D line from below, and the last column in the Avesome Oscillator is green, then the indicator gives a signal to buy.
Cari dalam skrip untuk "buy sell"

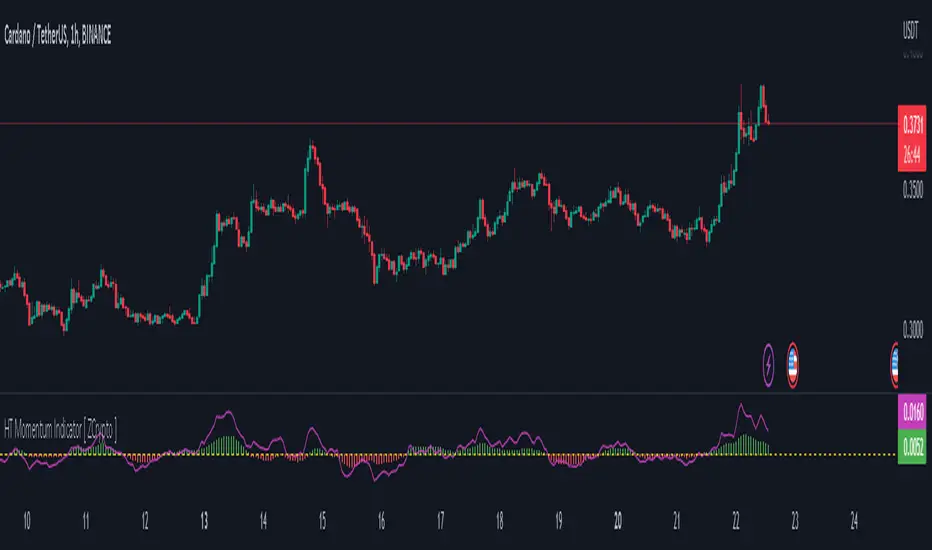
HT Momentum Indicator [ ZCrypto ]
The HT Momentum Indicator is a technical analysis tool that uses the Hyperbolic Tangent (tanh) function to measure momentum in a trading instrument.
This indicator is plotted as a histogram, with positive values indicating bullish momentum and negative values indicating bearish momentum.
Here are the main features and settings of the HT Momentum Indicator:
Source: This setting allows you to choose the price data used to calculate the momentum indicator. By default, the indicator uses the (High+Low+Close)/3 price, but you can select other options such as the open, high, or low prices.
Period: This setting determines the number of periods used in the momentum calculation. By default, the indicator uses a period of 14, but you can adjust this to suit your trading style and the market you are trading.
Show Fast/Slow/VWAP: These settings allow you to choose whether or not to display the fast and slow exponential moving averages (EMAs) and the volume-weighted average price (VWAP) on the chart.
Fast Length/Slow Length/VWAP Length: These settings allow you to adjust the length of the fast and slow EMAs and the VWAP calculation.
Bull Color/Bear Color: These settings allow you to choose the colors for the bullish and bearish histograms.
Zero Line: This indicator also includes a horizontal line at the zero level to help you identify when momentum is transitioning from bullish to bearish or vice versa.
The HT Momentum Indicator can be used to identify trends, momentum shifts, and potential buy/sell signals.
you can use the fast and slow EMAs to identify short-term and long-term trends, respectively, and the VWAP to gauge the strength of buying or selling pressure.
Additionally, the HT Momentum Indicator includes four pre-programmed alert conditions, which can notify you
when the fast EMA crosses above the slow EMA,
when the VWAP crosses above the zero line,
when the histogram transitions from negative to positive values.
when the histogram transitions from negative to positive values and VWAP above zero line
SumIndTarget:
The SumInd indicator combines Heiking Ashi, Sar Parabolic, Koncord, RSI, DMI, MACD and Bollinger Bands to give buy or sell signals or trends. This are called base indicators.
The goal is to have a clear and quick buy or sell suggestion and to avoid evaluating all or some of the named indicators, especially if they give contradictory signals among them. This speed and simplicity helps the trader to see several tickers in less time. It is intended for all markets and time periods where the above-mentioned indicators can be used.
How it works:
SumInd already has the importance or "weight" of each indicator named above configured, but they can be modified. You can set 0% for no use, or any other value based on the weight you want to give it, between 1% and 200% where 100% is the normal use, and increases or decreases based on importance.
Each base indicator can give signals to buy, sell or just "wait and see".
Each base indicator is checked for a buy signal, in which case its weight is added to the positive or green line, and if there is a sell signal, its weight is subtracted from the sell or red line. in case of indeterminacy or 'wait and see', nothing is added to any signal.
The yellow or total line is the sum of the buy or green signal plus the sell or red signal.
If the yellow or total line rises above the buy level, the background changes to green and an up arrow appears at the bottom of the chart indicating the buy suggestion, because most of the indicators you are interested in gave a buy signal.
If the yellow line or total falls below the sell level, the background changes to red and a downward arrow appears in the upper area of the chart indicating the sell suggestion, because most of the indicators you are interested in gave a sell signal.
The Buy and Sell level can be changed according to the security of the suggestion you need.
Areas without arrows or marks are considered "wait and see" areas, the previous trend in principle continues. They can be marked with the default background if desired from the SumInd settings.
Details and criterials:
Each of the following indicators can be turned on or off and assigned different weights of importances, by whether or not it shares the following criteria:
Heikin Ashi candles: add or subtract half an assigned weight if there is a buy or sell candle and the other half weight if there are two consecutive candles with the same signal.
RSI: Adds or subtracts the assigned weight if the ema is below or above the signal.
Parabolic Sar: Adds half a weight in transition to buy or sell and another half weight if there are two consecutive signals of the same trend.
Koncord: Add or subtract the weight if the current trend (mountain) grows or decreases respectively from the 4th previous time signal, and also the value (red line) is less than 35 or exceeds 65 respectively.
DMI: Adds or subtracts a quarter of the weight assigned by the DMI signal multiplied by the value of DMI, if the positive or negative signal exceeds the other negative or positive signal by 15% respectively.
Bollinger Bands: Add or subtract the weight if the previous third signal touches or falls out of the zone and keeps growing or decreasing respectively.
MACd: Add or subtract one third of the weight if the last 3 time signals are rising or falling, Add or subtract another third if the fast signal is above or below the slow signal, and Add or subtract the last third of the weight if it is rising with the negative fast signal, or falling with the positive fast signal.

Liquidity Candles with Prev Day High/Low and Midnight OpenAlright, let's talk about how to use this fancy indicator. But first, let me warn you, using indicators is like driving a car, you can't just press the gas pedal and hope for the best. You need to know what you're doing, or else you'll crash and burn faster than a soufflé in a microwave.
Now, let's get started. The first thing you need to do is understand what this indicator is telling you. Think of it like a signalman at a train station. He's waving flags and giving hand signals to tell you whether it's safe to proceed or if you need to stop and wait. This indicator works the same way.
It's going to give you signals based on price movements, telling you whether it's safe to buy or sell. But don't get too excited, my friend. You still need to use your brain and make smart decisions. Don't just blindly follow the signals, or else you'll end up like a sheep being led to the slaughter.
Now, let's talk about some of ICT's smart money trading concepts. First up, we have "liquidity grabs". This is when the big boys in the market create false breakouts to shake out the weak hands. They're like school bullies stealing lunch money from the little kids. But you can avoid being a victim by watching for signs of a liquidity grab, and using your brain to decide whether it's a real breakout or just a trap.
Next up, we have "stop runs". This is when the big players purposely trigger stop-loss orders to get a better entry or exit. It's like a game of chicken, but with your money on the line. To avoid being run over, keep an eye on your stop-loss orders, and don't be too predictable in your trading.
Finally, we have "market structure". This is like the blueprint of the market, showing you where the support and resistance levels are. It's like a treasure map to finding the best trades. But don't forget that market structure can change over time, so keep updating your map and stay ahead of the game.
So there you have it, my friend. A quick tutorial on using this indicator, with a side of ICT's smart money trading concepts. But remember, indicators are just tools, and you're the one driving the car. Use your brain, stay alert, and don't be a sheep. Happy trading!
Divergent Trades LLC:
Disclaimer: The information provided by the Divergent Trades LLC indicator is for educational and informational purposes only. It should not be considered financial advice or a recommendation to buy, sell, or trade any financial instrument. Divergent Trades LLC is not responsible for any losses incurred as a result of using this indicator. Trading in the financial markets carries a high level of risk and may not be suitable for all investors. Before making any investment decisions, please consult with a financial advisor and do your own due diligence. Past performance is not indicative of future results. By using the Divergent Trades LLC indicator, you acknowledge that you have read and understand this disclaimer and agree to its terms and conditions.

NET BSP NET BSP derived from Buying & Selling Pressure which is a volatility indicator that monitors average metrics of green and red candles separately.
We could navigate more confidently through market with projected market balance.
BSP allowed us to track and analyze the ongoing performance of bullish and bearish impulsive waves and their corrections.
Due to unintuitive way of measuring decline with SP going up, I decided to remake it into more intuitive version with better precision.
When we encounter the fall it's better to have declining values of tool to be able to cover it visually with ease.
One of the solutions was to create a sense of balance of Buying Pressure against Selling Pressure.
Since we are oriented by growth, it'd be more logical to summarize the market balance with BP - SP
Comparison:
When Buying and Selling Pressure are equal, NET BSP would be at 0.
NETBSP > 0 and NETBSP > NETBSP = 🟢
NETBSP > 0 and NETBSP < NETBSP = 🟡
NETBSP < 0 and NETBSP < NETBSP = 🔴
NETBSP < 0 and NETBSP > NETBSP = 🟡
Hence, we get visualized stages of uptrends and downtrends which allows to evaluate chances and estimations of upcoming counter-waves.
Also, it is worth to note that output clearly shows how one wave is derived from another in terms of sizing.
Feel free to adjust NET BSP arguments to adapt sensitivity to the timeframe you're working on.

Nifty36ScannerThis code is written for traders to be able to automatically scan 36 stocks of their choice for MACD , EMA200 + SuperTrend and Half Trend . Traders can be on any chart, and if they keep this scanner/indicator on , it will start displaying stocks meeting scanning criteria on the same window without having to go to Screener section and running it again and again. It will save time for traders and give them real time signals.
Indicators for scanning stocks are:
MACD
EMA200
Supertrend
HalfTrend - originally developed by EVERGET
Combination of EMA200 crossover/under and MACD crossover/under has worked well for me for long time, so using this combination as one of the criteria to
Scan the stocks. Using Everget's Half Trend method confirms the signal given by MACD , EMA200 and Supertrend Crossover.
I have added 36 of my favourite stocks from Nifty 50 lot. Users of this script can use the same stocks or change it by going into the settings of this scanner.
The Code is divided into 3 Sections
Section 1: Accepting input from users as boolean so that they can scan on the basis of one of the criteria or any combination of the criteria.
Section 2: "Screener function" to calculate Buy/ Sell on the basis of scanning criteria selected y the user.
screener=>
= ta.supertrend(2.5,10)
Buy/Sell on the basis of Supertrend crossing Close of the candle
//using ta.macd function to calculate MACD and Signal
= ta.macd(close, 12, 26, 9)
using HalfTrend indicator to calculate Buy/Sell signals , removed all the plotting functions from the code of Half Trend
Bringing Stock Symbols in S series variables
s1=input.symbol('NSE:NIFTY1!', title='Symbol1', group="Nifty50List", inline='0')
Assigning Bull/Bear ( Buy/Sell) signals to each stocks selected
=request.security(s1, tf, screener())
Assign BUY to all the stocks showing Buy signals using
buy_label1:= c1?buy_label1+str.tostring(s1)+'\n': buy_label1
Follow the same process for SELL Signals
Section 3: Plotting labels for the BUY/SELL result on the in terms of label for any stocks meeting the criteria with deletion of any previous signals to avoid clutter on the chart with so many signals generated in each candle
Display Buy siganaling stocks in teh form of label using Label.new function with parameters as follows:
barindex
close as series
color
textcolor
style as label_up,
yloc =price
textalign=left
Delete all the previous labels
label.delete(lab_buy )
STOCKS SELECTION
We have given range f 36 stocks from NIFTY 50 that can be selected at anytime,. User can chose their own 36 stocks using setting button.
INDICATORS SELECTION
1. MACD: It i sone of the most reliable trading strategy with 39.3% Success rate with 1.187 as profit factor for NIFTY Index on Daily time frame
2. EAM200 + Super trend : Combination of EMA200 crossover and Super trend removes any false positives and considered a very reliable way of scanning for Buy/Sell signals
3. HALF TREND: Originally developed as an indicator by Everget and modified as strategy by AlgoMojo, it generates Buy/Sell signals with 40.2% success rate with 1.469 as profit faction, on 15 minutes timeframe.

Ultimate Strategy Template (Advanced Edition)Hello traders
This script is an upgraded version of that one below
New features
- Upgraded to Pinescript version 5
- Added the exit SL/TP now in real-time
- Added text fields for the alerts - easier to send the commands to your trading bots
Step 1: Create your connector
Adapt your indicator with only 2 lines of code and then connect it to this strategy template.
For doing so:
1) Find in your indicator where are the conditions printing the long/buy and short/sell signals.
2) Create an additional plot as below
I'm giving an example with a Two moving averages cross.
Please replicate the same methodology for your indicator wether it's a MACD , ZigZag , Pivots , higher-highs, lower-lows or whatever indicator with clear buy and sell conditions.
//@version=5
indicator(title='Moving Average Cross', shorttitle='Moving Average Cross', overlay=true, precision=6, max_labels_count=500, max_lines_count=500)
type_ma1 = input.string(title='MA1 type', defval='SMA', options= )
length_ma1 = input(10, title=' MA1 length')
type_ma2 = input.string(title='MA2 type', defval='SMA', options= )
length_ma2 = input(100, title=' MA2 length')
// MA
f_ma(smoothing, src, length) =>
rma_1 = ta.rma(src, length)
sma_1 = ta.sma(src, length)
ema_1 = ta.ema(src, length)
iff_1 = smoothing == 'EMA' ? ema_1 : src
iff_2 = smoothing == 'SMA' ? sma_1 : iff_1
smoothing == 'RMA' ? rma_1 : iff_2
MA1 = f_ma(type_ma1, close, length_ma1)
MA2 = f_ma(type_ma2, close, length_ma2)
// buy and sell conditions
buy = ta.crossover(MA1, MA2)
sell = ta.crossunder(MA1, MA2)
plot(MA1, color=color.new(color.green, 0), title='Plot MA1', linewidth=3)
plot(MA2, color=color.new(color.red, 0), title='Plot MA2', linewidth=3)
plotshape(buy, title='LONG SIGNAL', style=shape.circle, location=location.belowbar, color=color.new(color.green, 0), size=size.normal)
plotshape(sell, title='SHORT SIGNAL', style=shape.circle, location=location.abovebar, color=color.new(color.red, 0), size=size.normal)
/////////////////////////// SIGNAL FOR STRATEGY /////////////////////////
Signal = buy ? 1 : sell ? -1 : 0
plot(Signal, title='🔌Connector🔌', display = display.data_window)
Basically, I identified my buy, sell conditions in the code and added this at the bottom of my indicator code
Signal = buy ? 1 : sell ? -1 : 0
plot(Signal, title="🔌Connector🔌", transp=100)
Important Notes
🔥 The Strategy Template expects the value to be exactly 1 for the bullish signal, and -1 for the bearish signal
Now you can connect your indicator to the Strategy Template using the method below or that one
Step 2: Connect the connector
1) Add your updated indicator to a TradingView chart
2) Add the Strategy Template as well to the SAME chart
3) Open the Strategy Template settings and in the Data Source field select your 🔌Connector🔌 (which comes from your indicator)
From then, you should start seeing the signals and plenty of other stuff on your chart
🔥 Note that whenever you'll update your indicator values, the strategy statistics and visual on your chart will update in real-time
Settings
- Color Candles: Color the candles based on the trade state ( bullish , bearish , neutral)
- Close positions at market at the end of each session: useful for everything but cryptocurrencies
- Session time ranges: Take the signals from a starting time to an ending time
- Close Direction: Choose to close only the longs, shorts, or both
- Date Filter: Take the signals from a starting date to an ending date
- Set the maximum losing streak length with an input
- Set the maximum winning streak length with an input
- Set the maximum consecutive days with a loss
- Set the maximum drawdown (in % of strategy equity)
- Set the maximum intraday loss in percentage
- Limit the number of trades per day
- Limit the number of trades per week
- Stop-loss: None or Percentage or Trailing Stop Percentage or ATR - I'll add shortly multiple options for the trailing stop loss
- Take-Profit: None or Percentage or ATR - I'll add also a trailing take profit
- Risk-Reward based on ATR multiple for the Stop-Loss and Take-Profit
Special Thanks
Special thanks to @JosKodify as I borrowed a few risk management snippets from his website: kodify.net
Best
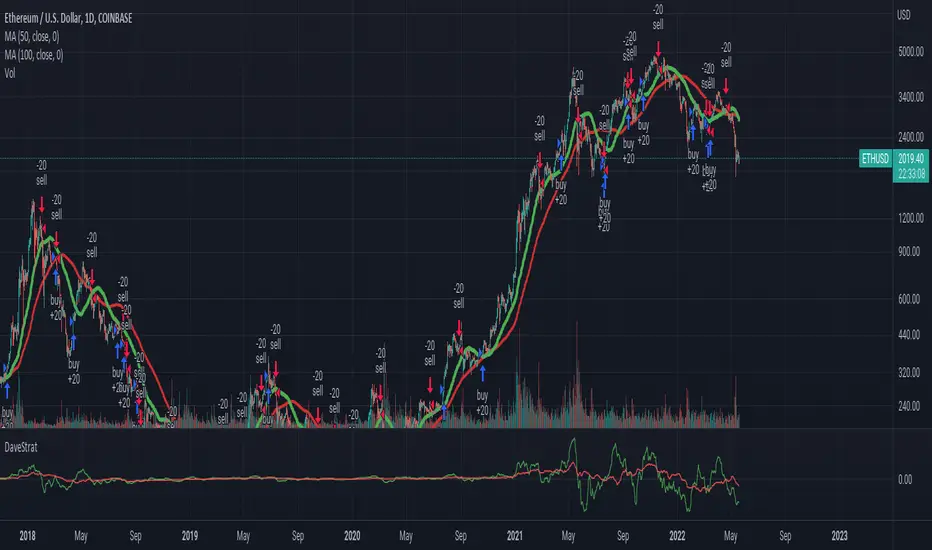
Dave

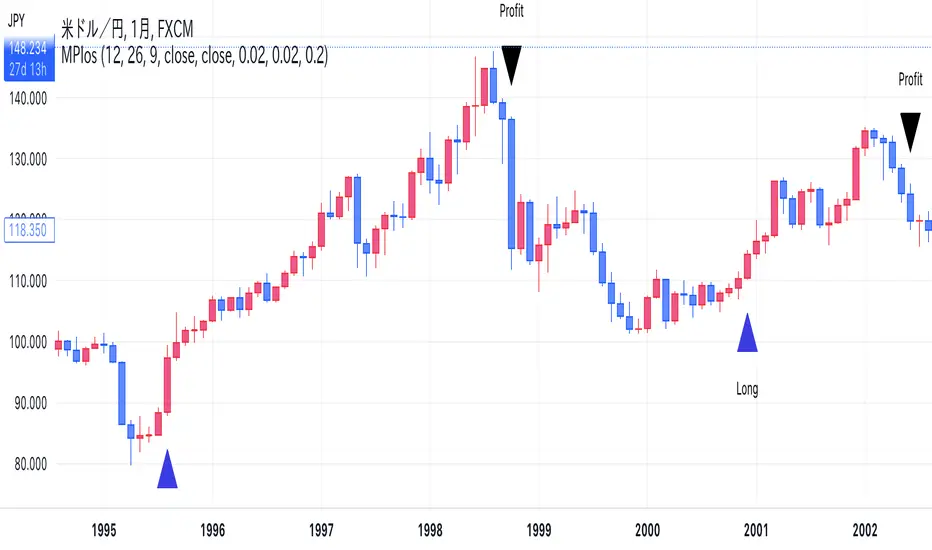
MPI(only signal)I have removed the MACD and Parabolic SAR displays used in the calculations from my work, MPI, and changed them to show only buy/sell signals.
There is no difference from the previously posted MPI other than the appearance, including the alerts.
Please use whichever looks better.
In case you are interested, I will post the same description again as the MPI I posted last time.
- - - - - - - - -
This indicator is used to make trading decisions for ETFs and mutual funds ( TQQQ , QLD , SPXL , etc.) that are leveraged to stock indices.
It displays buy and sell signals and sends notifications when both MACD and Parabolic SAR give trend reversal signals.
Specifically, the following cases are considered as buy/sell signals.
Buy signal
-When Parabolic SAR shows a buy signal after MACD has made a golden cross
-When MACD shows a golden cross after Parabolic SAR shows a buy signal
Sell signal
-When Parabolic SAR shows a sell signal after MACD has made a dead cross
-When MACD shows a dead cross after Parabolic SAR shows a sell signal
Apply this indicator to the underlying index of the leveraged ETF ( NDX for TQQQ and QLD ) and trade the leveraged ETF using the buy or sell signal on the underlying index.
Note that the stocks to which you apply this indicator and make trading decisions are different from the stocks that you actually trade.
- - - - - - - - -
私の作品であるMPIから計算に使用しているMACDとパラボリックSARの表示を取り除き、売買シグナルのみ表示するように変更しました。
アラートを含め、見た目以外に前回投稿したMPIとの違いはありません。
どちらか見た目が好きな方を使ってください。
興味のある方向けに、前回投稿したMPIと同じ説明文を再度掲載します。
- - - - - - - - -
株価指数にレバレッジをかけたETFや投資信託( TQQQ , QLD , SPXL など)の売買判断をするためのインジケーターです。
MACDとパラボリックSARの両方でトレンド転換シグナルが出たところで売買シグナルを表示し、通知を送ります。
具体的には以下のような場合を売買シグナルとします。
買いシグナル
・MACDがゴールデンクロスした後、パラボリックSARが買いシグナルを示したとき
・パラボリックSARが買いシグナルを示した後、MACDがゴールデンクロスしたとき
売りシグナル
・MACDがデッドクロスした後、パラボリックSARが売りシグナルを示したとき
・パラボリックSARが売りシグナルを示した後、MACDがデッドクロスしたとき
このインジケーターをレバレッジETFの元指数( TQQQ , QLD ならば NDX )に適用し、元指数での売買シグナルでレバレッジETFを売買してください。
このインジケーターを適用し売買判断を行う銘柄と実際に売買する銘柄が違うことに注意してください。
- - - - - - - - -
Overlay - HARSI + Divergences // All credit to © //@author=JayRogers & VuManChu Cipher B for their original Scripts (Open Source)
/ ====== ABOUT THIS INDICATOR
// I've combined some part of the code of the following indicators to get some alerts based on the Idea and Use section below :
// - RSI based Heikin Ashi candle oscillator
// - Divergence based on the VuManChu Cipher B
// -- This is the OVERLAY Version
//
// ====== ARTICLES and FURTHER READING
//
// - www.investopedia.com
//
// "Heikin-Ashi is a candlestick pattern technique that aims to reduce
// some of the market noise, creating a chart that highlights trend
// direction better than typical candlestick charts"
//
// ====== IDEA AND USE
// - The use of the HA RSI indicator when in the OverSold and OverBought
// area combined to a Divergence & a OB/OS buy/sell
// on the Cipher B by VuManChu.
// Can be useful as a confluence at S/R levels.
// *** Tip = 1 minute timeframe seems to work the best on FOREX
//
// *** Alerts :
// - The Divergence alert needs 2 bar to calculate,
// so alerts and dots as well, it will be placed on the right spot on
// the chart as per the offset added.
// - Use "Once Per Bar" for the alert, not per bar close, or you would
// have 1 extra bar delay
//
// ** Contributions : Remodel some part of the original script in order to get :
// --> Total conditions for an alert and a dot to display, resumed :
// - Buy/Sell in OB/OS
// - Divergence Buy/Sell
// - RSI Overlay is in OB/OS on current bar (or was the bar before)
// when both Buy/Sell dots from VMC appears.
//
// ====== DISCLAIMER
// For Tradingview & Pinescript moderators =
// This follow a strategy where RSI Overlay from @JayRogers script shall be
// in OB/OS zone, while combining it with the VuManChu Cipher B Divergences
// Buy&Sell + Buy/sell alerts In OB/OS areas.
// Any trade decisions you make are entirely your own responsibility.
//
// Thanks to dynausmaux for the code
// Thanks to falconCoin for inspired me to start this.
// Thanks to LazyBear for WaveTrend Oscillator
// Thanks to RicardoSantos for

HARSI + Divergences// All credit to © //@author=JayRogers & VuManChu Cipher B for their original Scripts (Open Source)
/ ====== ABOUT THIS INDICATOR
// I've combined some part of the code of the following indicators to get some alerts based on the Idea and Use section below :
// - RSI based Heikin Ashi candle oscillator
// - Divergence based on the VuManChu Cipher B
//
// ====== ARTICLES and FURTHER READING
//
// - www.investopedia.com
//
// "Heikin-Ashi is a candlestick pattern technique that aims to reduce
// some of the market noise, creating a chart that highlights trend
// direction better than typical candlestick charts"
//
// ====== IDEA AND USE
// - The use of the HA RSI indicator when in the OverSold and OverBought
// area combined to a Divergence & a OB/OS buy/sell
// on the Cipher B by VuManChu.
// Can be useful as a confluence at S/R levels.
// *** Tip = 1 minute timeframe seems to work the best on FOREX
//
// *** Alerts :
// - The Divergence alert needs 2 bar to calculate,
// so alerts and dots as well, it will be placed on the right spot on
// the chart as per the offset added.
// - Use "Once Per Bar" for the alert, not per bar close, or you would
// have 1 extra bar delay
//
// ** Contributions : Remodel some part of the original script in order to get :
// --> Total conditions for an alert and a dot to display, resumed :
// - Buy/Sell in OB/OS
// - Divergence Buy/Sell
// - RSI Overlay is in OB/OS on current bar (or was the bar before)
// when both Buy/Sell dots from VMC appears.
//
// ====== DISCLAIMER
// For Tradingview & Pinescript moderators =
// This follow a strategy where RSI Overlay from @JayRogers script shall be
// in OB/OS zone, while combining it with the VuManChu Cipher B Divergences
// Buy&Sell + Buy/sell alerts In OB/OS areas.
// Any trade decisions you make are entirely your own responsibility.
//
// Thanks to dynausmaux for the code
// Thanks to falconCoin for inspired me to start this.
// Thanks to LazyBear for WaveTrend Oscillator
// Thanks to RicardoSantos for

VWAP BANDS [qrsq]Description
This indicator is used to find support and resistance utilizing both buying and selling volume. It can be used on lower and higher time frames to understand where price is likely to reject or bounce.
How it works
Instead of calculating the VWAP using the total volume, this script estimates the buying/selling volume and respectively calculates their individual VWAP's. The standard deviations of these are then calculated to create the set of two bands. The top bands being the VWAP from buying volume and bottom bands are from selling volume, with the option to use a double band on either pair.
How to use it
I like to use the bands for LTF scalping as well as HTF swings, I also like to use it alongside my SMA VWAP BANDS.
For scalping:
I tend to use either the 5m or 15m TF
I then set the indicator's TF to 1m
I will take a scalp based on the bands confluence with other PA methods, if price is being either supported or rejected.
For swings:
I tend to use a variety of TFs, including: 30m, 1H, 4H, D
I then set the indicator's TF to "Chart"
I will take a swing based on the bands confluence with other PA methods, if price is being either supported or rejected.
I also tend to use them on perpetual contracts as the volume seems to be more consistent and hence results in more accurate support and resistance.

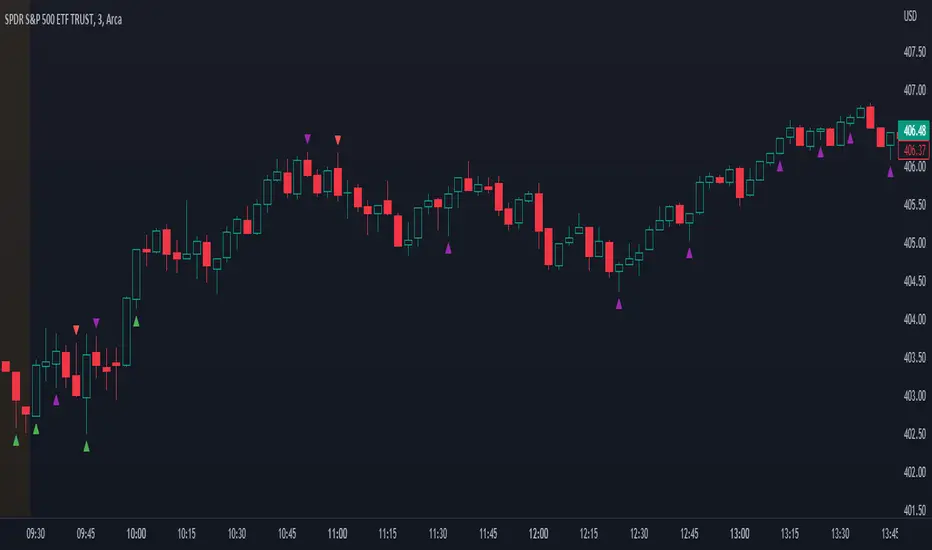
Price Action Signals V2Indicator that shows buy/sell signals based on price action and volume as it relates to a double EMA. If the candle is above the double EMA, we look for candles with long wicks on the top indicating selling pressure. If the candle is below the double EMA , we look for candles with a long bottom wick indicating buying pressure. The user defined parameters are the length of the double EMA and the length of the volume moving average. Lower timeframes such as 5 minutes and lower are better off using lower lengths while higher timeframes should user higher lengths. Your mileage will vary.
Note, while this indicator can signal the beginning of long term trends, it will also signal minor retracements. Do not blindly buy or sell based on a signal appearing, pay attention to where the candle is in the overall trend and wait for confirmation to avoid losses.
Hussarya Volume cumulated. Buy Sell.
Volume frome curent chart or cumulated volume from Binance, Bybit Kraken, Ftx and Coinbase.
You can chose also. log scale on simple or cumulated volume.
Colors:
Grey. total volume
Red. sell Volume
Green. Buy volume
Red or green shows only bigger value

Trendlines Boll Ichi S1 by GammaprodI. How to use this indicator :
------------------------------
I.1. Set your teadingview theme to dark theme.
I.2. Gammaprod indicator is valid for forex, stock and but more valid for crypto.
I.3. Use three timeframe for more validation (choose between those, that fit to your trading style) :
- Timeframe 1m, 5m, and 15m for Scalping
- Timeframe 30m, 1h and 4h for Intraday
- Timeframe 4h, 1D and 1W for Swing Trading
I.4 Always use THREE INDICATORS FROM GAMMAPROD, those three indicators is back to back each other, by the way, I only made those three indicators only (for now) :
- Trendlines Boll Ichi S1 by Gammaprod
- MACD Volume S2 by Gammaprod
- Stoch RSI Divs Zone S2 by Gammaprod
============================================================================
II. How to setting :
--------------------
II.1. Trendlines Boll Ichi Crypto by Gammaprod
II.1.A. Support and Resistance
- Well if you familiar with this indicator you can add it, but recommended for Timeframe 30m or more
II.1.B. Trendlines Primary or Trendlines Secondary
- Timeframe 1m you DON'T NEED Trendlines Primary or Trendlines Secondary
- Timeframe 5m you DON'T NEED Trendlines Secondary, but you CAN ADD Trendlines Primary if you fell it helpful (for me, it is helpful to find where the candles start or the end trend or a consolidation or where the candles will surpass a resistance or a support).
- Timeframe 15m you DON'T NEED Trendlines Secondary, DEFENITELY add Trendlines Primary it will help to find where the candles stop or a consolidation or where the candles will surpass a resistance or a support).
- Timeframe 30m or more, DEFENITELY NEED BOTH Trendlines Primary and Secondary Trendlines, it will help to find where the candle stop or consolidation or where the candle will surpass a resistance or support).
II.1.C. Bollinger, Ichimoku Cloud and Lagging Span
- Please DON'T CHANGE IT at all, it's really helpful to know when and where to make an entry decesion or a trend or a consolidation, if you don't understand how to read it, you better to learn it first (on "how to read" section and "How to OPEN position" the section below)
II.2. Stoch RSI Divs Zone Crypto by Gammaprod (DON'T CHANGE IT)
II.3. MACD Volume Crypto by Gammaprod (DON'T CHANGE IT)
============================================================================
III. How to read :
------------------
III.1. Sell or Buy Priority :
III.1.A. Sell Priority
- Color background on macd and stoch rsi is pink or purple sell is the priority, (if you're not sure to buy, just wait until the best moment to sell)
III.1.B. Buy Priority
- Color background on macd and stoch rsi Teal or light green buy is the priority, (if you're not sure to sell, just wait until the best moment to buy)
III.1.C. Indecision / Golden Moment
- Color background on stoch rsi yellow is indecision / golden moment of reversal pattern (wait until it formed background only on Stoch RSI), please be careful at this moment.
III.2. Trend / Consolidation :
III.2.A. BULLISH trend
- When Stoch RSI and MACD have teal or light green background that's means BULLISH trend, better to confirm by the candle is above green cloud and lagging span (red line) is also above the candle.
III.2.B. BEARISH trend
- When Stoch RSI and MACD have the Pink or purple background that's means BEARISH trend, better to confirm by the candle is above purple cloud and lagging span (red line) is also below the candle.
III.2.C. CONSOLIDATION
- When Stoch RSI have the mix background that's means CONSOLIDATION, better to confirm by the candle is in or near to green / purple cloud and lagging span (red line) is also on the candle.
III.3. Special Mark
III.3.A. Ideal Bullish :
- Near line 20 and green / teal background = When Stoch RSI have the char R / H on lime color label, that's means divergence or hidden divergence for buy position, if you not see this label that's means just a standard confirmation for buy
III.3.B. Not an Ideal Bullish :
- Near line 80 and green / teal background = if this happens make sure you know what happen, it could be a false signal or bullish continual pattern
III.3.C. Ideal Bearish :
- Near line 80 and pink / purple background = When Stoch RSI have the char R / H on lime color label, that's means divergence or hidden divergence for buy position, if you not see this label that's means just a standard confirmation for sell position.
III.3.D. Not an Ideal Bearish:
- Near line 20 and pink / purple background = if this happens make sure you know what happen, it could be a false signal or bearish continual pattern
III.3.E. The Beginning of Reversal (from BEARISH to BULLISH) :
- When Stoch RSI line shaping GREEN position is near 20.
- MACD lines still PINK, position lines is UNDER the HISTOGRAM, but the HISTOGRAM start to SHAPE FALL PINK (light pink) and the BACKGROUND still PINK / PURPLE.
- Position CANDLES NEAR BLUE line, NEAR PURPLE CLOUD, and lagging span (red line) STILL ON the area candle. (it used to be confirmed with the golden moment).
III.3.F. The Beginning of Reversal (from BULLISH to BEARISH) :
- When Stoch RSI line shaping PINK position is near 80.
- MACD lines still GREEN, position lines is ABOVE the HISTOGRAM, but the HISTOGRAM start to SHAPE FALL GREEN (light green) and the BACKGROUND still TEAL / GREEN.
- Position CANDLES NEAR WHITE line, NEAR TEAL CLOUD, and lagging span (red line) STILL ON the area candle. (it used to be confirmed with the golden moment).
III.3.G. False Signals, or It could be a Golden Moment (better to see it on TF 15 or bigger):
- Near line 20 or 80 and yellow background = When Stoch RSI have the char R / H on color label, that's means divergence or hidden divergence for buy / sell position, if you not see this label that's means just a standard confirmation for buy / sell depends on where the Stoch RSI line if near 20 that's means buy, near 80 means sell
============================================================================
IV. How to OPEN position:
-------------------------
IV.1. Bullish
IV.1.A. Trendlines Boll Ichi S1 by Gammaprod
- The candles above the green cloud.
- Lagging span (red line) above the candles.
- then open buy near yellow line (the first option) / blue line (the second option) (always confirm the position with two other indicators below).
IV.1.B. MACD Volume S2 by Gammaprod
- Teal or Green background.
- The lines is shaped or shaping green.
- Better if at the green histogram.
IV.1.C. Stoch RSI Divs Zone S3 by Gammaprod
- Teal or Green background.
- The lines is shaping green.
- Better if on the bottom (at a range 20).
IV.2. Bearish
IV.2.A. Trendlines Boll Ichi S1 by Gammaprod
- The candles below the purple cloud.
- Lagging span (red line) below the candles.
- then open buy near yellow line (the first option) / white line (the second option) (always confirm the position with two other indicators below).
IV.2.B. MACD Volume S2 by Gammaprod
- Pink or purple background.
- The lines are shaped or shaping green.
- Better if at the pink histogram.
IV.2.C. Stoch RSI Divs Zone S3 by Gammaprod
- Pink or purple background.
- The lines are shaping pink.
- Better if the line on the top (at a range 80).
IV.3. Consolidation
IV.3.A. Trendlines Boll Ichi S1 by Gammaprod
- The candles on the cloud (green or purple).
- Lagging span (red line) on the candles.
- then open buy near the white or blue line (always confirm the position with two other indicators below).
IV.3.B. MACD Volume S2 by Gammaprod
- Changing the background.
- The line is near the middle line.
- Have small Histogram.
IV.3.C. Stoch RSI Divs Zone S3 by Gammaprod
- Mix background specially on a timeframe 15m or more.
- The line move fast up and down.
- Better if on the bottom or the top of the lines (at a range 20 or 80).
============================================================================
>> The secret ingredient is comparing the timeframe :
The example scalping (Timeframe 1m, 5m and 15m)
- TF 1m is for making an open position.
- TF 5m is for making a judgement of the trend market.
- TF 15m is to confirm that judgement from TF 5m, be careful if it not similar then it used to be a consolidation or the beginning of the reversal.
There's a lot a way to open the position than above information that i gave it to you, but consider there are a limit chars on this column, I hope it will help your trading and make a more profit on it.

Price Action SignalsIndicator that shows buy/sell signals based on price action as it relates to a 20 day moving average. If the candle is above the 20 day moving average, we look for candles with long wicks on the top indicating selling pressure. If the candle is below the 20 day moving average we look for candles with a long bottom wick indicating buying pressure. The rules for the wick and the price action can be modified by the user. The two user defined parameters are price movement and wick length.
For instance, the user can choose to only show arrows when candle has moved by X amount. The smaller the timeframe, the smaller the amount. I Recommended the following values when looking at SPY:
On a 1m chart: .10 cents
5min chart: .15 cents
15m chart: .25 cents
1h chart: 1 dollar,
1D chart: 2 dollars
Your mileage will vary.
With the wicks, you choose a percentage. You can choose to only show an arrow above or below a candle if the wick size is at least x% the size of the candle body.

Delta Volume by SiddWolfDelta Volume is Difference between Buying Volume and Selling Volume. This indicator gives the Delta Volume based on Lower TimeFrame Candles. It utilizes security_lower_tf() function, a function that provides Lower TF candle data in Higher TF Chart.
security_lower_tf() is a new function provided by TradingView yesterday. If you are a PineScript Programmer, I suggest you to read about it, as it is a very powerful function that can extremely improve your trading strategy.
How this indicator works:
This indicator checks volume data on lower TimeFrame Candles and Shows it's delta in the current Chart Timeframe. For example: If you open 4 hours chart, this indicator checks volume of 1 minute chart and separates Buying-Selling volume. Then it subtracts Candle's Selling volume from Candle's Buying volume, finally calculating the Delta Volume.
This indicator also provides a Smooth Delta Volume, which is moving average of Delta Volume. As Delta Volume changes a lot, Smooth Delta Volume can be very helpful for identifying Trends . Goto settings and in "Show" section select "Smooth Delta Volume" to lay it on the chart.
Settings is the Key:
Settings are key to all of my indicators. Play around with it a bit. You can change what to show on the chart from settings. Smooth Delta Volume moving average length can be changed from the settings. You can also select "Show as Percentage", which shows Delta Volume as Percentage of Overall Candle's Volume. If you use Weekly or Monthly Timeframe, change increase lower timeframe from settings. Read the tooltips to understand what each settings mean. Tooltips are the (i) button in-front of each settings.
FAQs:
Q. Does the indicator Repaint ?
--- No. None of my indicators repaints. What you see now is what's drawn in real time.
Q. What TimeFrame is Best for this Indicator ?
--- It can be used on timeframes from 5 minutes to higher. But I would prefer to use it from timeframes higher than 30 minutes, as it gathers data from 1 minute TF.
Q. Indicator doesn't show anything ?
--- This indicator only works on security with Volume data. Also use it from higher timeframe than specified in Settings, because Volume Delta is calculated using Data from Lower TimeFrame.
Q. Delta volume is not provided by TradingView, So how exactly does this indicator work?
--- This indicator takes advantage of new pinescript function security_lower_tf(), and calculates volume for smaller timeframe data and calculates delta on higher timeframe.
Q. Does this indicator give financial advice?
--- No. Nope. Nein. Não. नहीं.
Conclusion:
This indicator is very basic but if used correctly it can be very powerful. If you have any questions or suggestions feel free to comment below. I'd love to connect with you. Thank you.
~ @SiddWolf

MACD Volume S2 By Gammaprod>> How to use this indicator :
1. Set your teadingview theme to dark theme.
2. My indicator is valid for forex, stock and but more valid for crypto.
3. Use three timeframe for more validation (choose between those, that fit to your trading style) :
- Timeframe 1m, 5m, and 15m for Scalping
- Timeframe 30m, 1h and 4h for Intraday
- Timeframe 4h, 1D and 1W for Swing Trading
4 . Always use THREE INDICATORS FROM GAMMAPROD, those three indicators is back to back each other, by the way, I only made those three indicators only (for now) :
- Trendlines Boll Ichi Crypto by Gammaprod
- Stoch RSI Divs Zone Crypto by Gammaprod
- MACD Volume Crypto by Gammaprod
>> How to setting :
1. Trendlines Boll Ichi Crypto by Gammaprod
A. Support and Resistence
- Well if you familiar with this indicator you can add it, but recommended for Timeframe 30m or more
B. Trendlines Primary or Trendlines Secondary
- Timeframe 1m you DON'T NEED Trendlines Primary or Trendlines Secondary
- Timeframe 5m you DON'T NEED Trendlines Secondary, but you CAN ADD Trendlines Primary if you fell it helpful (for me, it is helpful to find where the candles start or the end trend or a consolidation or where the candles will surpass a resistance or a support).
- Timeframe 15m you DON'T NEED Trendlines Secondary, DEFENITELY add Trendlines Primary it will help to find where the candles stop or a consolidation or where the candles will surpass a resistance or a support).
- Timeframe 30m or more, DEFENITELY NEED BOTH Trendlines Primary and Secondary Trendlines, it will help to find where the candle stop or consolidation or where the candle will surpass a resistance or support).
C. Bolinger, Ichimoku Cloud and Lagging Span
- Please DON'T CHANGE IT at all, it's really helpful to know when and where to make an entry decesion or a trend or a consolidation, if you don't understand how to read it, you better to learn it first (on "how to read" section and "How to OPEN position" the section below)
2. Stoch RSI Divs Zone Crypto by Gammaprod (DON'T CHANGE IT)
3. MACD Volume Crypto by Gammaprod (DON'T CHANGE IT)
>> How to read :
1. Sell or Buy Priority :
A. Buy Priority
- Color background on macd and stoch rsi is pink or purple sell is the priority, (if you're not sure to buy, just wait until the best moment to sell)
B. Buy Priority
- Color background on macd and stoch rsi Teal or light green buy is the priority, (if you're not sure to sell, just wait until the best moment to buy)
C. Indecision / Golden Moment
- Color background on stoch rsi yellow is indecision / golden moment of reversal pattern (wait until it formed background only on Stoch RSI), please becareful at this moment.
2. Trend / Consolidation :
A. BULLISH trend
- When Stoch RSI and MACD have teal or light green background that's means BULLISH trend, better to confirm by the candle is above green cloud and lagging span (red line) is also above the candle.
B. BEARISH trend
- When Stoch RSI and MACD have the Pink or purple background that's means BEARISH trend, better to confirm by the candle is above purple cloud and lagging span (red line) is also below the candle.
C. CONSOLIDATION
- When Stoch RSI have the mix background that's means CONSOLIDATION, better to confirm by the candle is in or near to green / purple cloud and lagging span (red line) is also on the candle.
3. Special Mark
A. Ideal Bullish :
- Near line 20 and green / teal background = When Stoch RSI have the char R / H on lime color label, that's means divergence or hidden divergence for buy position, if you not see this label that's means just a standard confirmation for buy
B. Not an Ideal Bullish :
- Near line 80 and green / teal background = if this happens make sure you know what happen, it could be a false signal or bullish continual pattern
C. Ideal Bearish :
- Near line 80 and pink / purple background = When Stoch RSI have the char R / H on lime color label, that's means divergence or hidden divergence for buy position, if you not see this label that's means just a standard confirmation for sell position.
D. Not an Ideal Bearish:
- Near line 20 and pink / purple background = if this happens make sure you know what happen, it could be a false signal or bearish continual pattern
E. The Beginning of Reversal (from BEARISH to BULLISH) :
- When Stoch RSI line shaping GREEN position is near 20.
- MACD lines still PINK, position lines is UNDER the HISTOGRAM, but the HISTOGRAM start to SHAPE FALL PINK (light pink) and the BACKGROUND still PINK / PURPLE.
- Position CANDLES NEAR BLUE line, NEAR PURPLE CLOUD, and lagging span (red line) STILL ON the area candle. (it used to be confirmed with the golden moment).
F. The Beginning of Reversal (from BULLISH to BEARISH) :
- When Stoch RSI line shaping PINK position is near 80.
- MACD lines still GREEN, position lines is ABOVE the HISTOGRAM, but the HISTOGRAM start to SHAPE FALL GREEN (light green) and the BACKGROUND still TEAL / GREEN.
- Position CANDLES NEAR WHITE line, NEAR TEAL CLOUD, and lagging span (red line) STILL ON the area candle. (it used to be confirmed with the golden moment).
G. False Signals, or It could be a Golden Moment (better to see it on TF 15 or bigger):
- Near line 20 or 80 and yellow background = When Stoch RSI have the char R / H on color label, that's means divergence or hidden divergence for buy / sell position, if you not see this label that's means just a standard confirmation for buy / sell depends on where the Stoch RSI line if near 20 that's means buy, near 80 means sell
>> How to OPEN position:
A. Bullish
1. Trendlines Boll Ichi Crypto by Gammaprod
- The candles above the green cloud.
- Lagging span (red line) above the candles.
- then open buy near yellow line (the first option) / blue line (the second option) (always confirm the position with two other indicators below).
2. Stoch RSI Divs Zone Crypto by Gammaprod
- Teal or Green background.
- The lines is shaping green.
- Better if on the bottom (at a range 20).
3. MACD Volume Crypto by Gammaprod
- Teal or Green background.
- The lines is shaped or shaping green.
- Better if at the green histogram.
B. Bearish
1. Trendlines Boll Ichi Crypto by Gammaprod
- The candles below the purple cloud.
- Lagging span (red line) below the candles.
- then open buy near yellow line (the first option) / white line (the second option) (always confirm the position with two other indicators below).
2. Stoch RSI Divs Zone Crypto by Gammaprod
- Pink or purple background.
- The lines are shaping pink.
- Better if the line on the top (at a range 80).
3. MACD Volume Crypto by Gammaprod
- Pink or purple background.
- The lines are shaped or shaping green.
- Better if at the pink histogram.
C. Consolidation
1. Trendlines Boll Ichi Crypto by Gammaprod
- The candles on the cloud (green or purple).
- Lagging span (red line) on the candles.
- then open buy near the white or blue line (always confirm the position with two other indicators below).
2. Stoch RSI Divs Zone Crypto by Gammaprod
- Mix background specially on a timeframe 15m or more.
- The line move fast up and down.
- Better if on the bottom or the top of the lines (at a range 20 or 80).
3. MACD Volume Crypto by Gammaprod
- Changing the background.
- The line is near the middle line.
- Have small Histogram.
>> The secret ingridient is comparing the timeframe :
The example scalping (Timeframe 1m, 5m and 15m)
- TF 1m is for making an open position.
- TF 5m is for making a judgement of the trend market.
- TF 15m is to confirm that judgement from TF 5m, be careful if it not similar then it used to be a consolidation or the beginning of the reversal.
There's a lot a way to open the position than above information that i gave it to you, but consider there are a limit char on this column, I hope it will help your trading and make a more profit on it.

Stoch RSI, Div, Zone S3 by Gammaprod>> How to use this indicator :
1. Set your teadingview theme to dark theme.
2. My indicator is valid for forex, stock and but more valid for crypto.
3. Use three timeframe for more validation (choose between those, that fit to your trading style) :
- Timeframe 1m, 5m, and 15m for Scalping
- Timeframe 30m, 1h and 4h for Intraday
- Timeframe 4h, 1D and 1W for Swing Trading
4 . Always use THREE INDICATORS FROM GAMMAPROD, those three indicators is back to back each other, by the way, I only made those three indicators only (for now) :
- Trendlines Boll Ichi Crypto by Gammaprod
- Stoch RSI Divs Zone Crypto by Gammaprod
- MACD Volume Crypto by Gammaprod
>> How to setting :
1. Trendlines Boll Ichi Crypto by Gammaprod
A. Support and Resistence
- Well if you familiar with this indicator you can add it, but recommended for Timeframe 30m or more
B. Trendlines Primary or Trendlines Secondary
- Timeframe 1m you DON'T NEED Trendlines Primary or Trendlines Secondary
- Timeframe 5m you DON'T NEED Trendlines Secondary, but you CAN ADD Trendlines Primary if you fell it helpful (for me, it is helpful to find where the candles start or the end trend or a consolidation or where the candles will surpass a resistance or a support).
- Timeframe 15m you DON'T NEED Trendlines Secondary, DEFENITELY add Trendlines Primary it will help to find where the candles stop or a consolidation or where the candles will surpass a resistance or a support).
- Timeframe 30m or more, DEFENITELY NEED BOTH Trendlines Primary and Secondary Trendlines, it will help to find where the candle stop or consolidation or where the candle will surpass a resistance or support).
C. Bolinger, Ichimoku Cloud and Lagging Span
- Please DON'T CHANGE IT at all, it's really helpful to know when and where to make an entry decesion or a trend or a consolidation, if you don't understand how to read it, you better to learn it first (on "how to read" section and "How to OPEN position" the section below)
2. Stoch RSI Divs Zone Crypto by Gammaprod (DON'T CHANGE IT)
3. MACD Volume Crypto by Gammaprod (DON'T CHANGE IT)
>> How to read :
1. Sell or Buy Priority :
A. Buy Priority
- Color background on macd and stoch rsi is pink or purple sell is the priority, (if you're not sure to buy, just wait until the best moment to sell)
B. Buy Priority
- Color background on macd and stoch rsi Teal or light green buy is the priority, (if you're not sure to sell, just wait until the best moment to buy)
C. Indecision / Golden Moment
- Color background on stoch rsi yellow is indecision / golden moment of reversal pattern (wait until it formed background only on Stoch RSI), please becareful at this moment.
2. Trend / Consolidation :
A. BULLISH trend
- When Stoch RSI and MACD have teal or light green background that's means BULLISH trend, better to confirm by the candle is above green cloud and lagging span (red line) is also above the candle.
B. BEARISH trend
- When Stoch RSI and MACD have the Pink or purple background that's means BEARISH trend, better to confirm by the candle is above purple cloud and lagging span (red line) is also below the candle.
C. CONSOLIDATION
- When Stoch RSI have the mix background that's means CONSOLIDATION, better to confirm by the candle is in or near to green / purple cloud and lagging span (red line) is also on the candle.
3. Special Mark
A. Ideal Bullish :
- Near line 20 and green / teal background = When Stoch RSI have the char R / H on lime color label, that's means divergence or hidden divergence for buy position, if you not see this label that's means just a standard confirmation for buy
B. Not an Ideal Bullish :
- Near line 80 and green / teal background = if this happens make sure you know what happen, it could be a false signal or bullish continual pattern
C. Ideal Bearish :
- Near line 80 and pink / purple background = When Stoch RSI have the char R / H on lime color label, that's means divergence or hidden divergence for buy position, if you not see this label that's means just a standard confirmation for sell position.
D. Not an Ideal Bearish:
- Near line 20 and pink / purple background = if this happens make sure you know what happen, it could be a false signal or bearish continual pattern
E. The Beginning of Reversal (from BEARISH to BULLISH) :
- When Stoch RSI line shaping GREEN position is near 20.
- MACD lines still PINK, position lines is UNDER the HISTOGRAM, but the HISTOGRAM start to SHAPE FALL PINK (light pink) and the BACKGROUND still PINK / PURPLE.
- Position CANDLES NEAR BLUE line, NEAR PURPLE CLOUD, and lagging span (red line) STILL ON the area candle. (it used to be confirmed with the golden moment).
F. The Beginning of Reversal (from BULLISH to BEARISH) :
- When Stoch RSI line shaping PINK position is near 80.
- MACD lines still GREEN, position lines is ABOVE the HISTOGRAM, but the HISTOGRAM start to SHAPE FALL GREEN (light green) and the BACKGROUND still TEAL / GREEN.
- Position CANDLES NEAR WHITE line, NEAR TEAL CLOUD, and lagging span (red line) STILL ON the area candle. (it used to be confirmed with the golden moment).
G. False Signals, or It could be a Golden Moment (better to see it on TF 15 or bigger):
- Near line 20 or 80 and yellow background = When Stoch RSI have the char R / H on color label, that's means divergence or hidden divergence for buy / sell position, if you not see this label that's means just a standard confirmation for buy / sell depends on where the Stoch RSI line if near 20 that's means buy, near 80 means sell
>> How to OPEN position:
A. Bullish
1. Trendlines Boll Ichi Crypto by Gammaprod
- The candles above the green cloud.
- Lagging span (red line) above the candles.
- then open buy near yellow line (the first option) / blue line (the second option) (always confirm the position with two other indicators below).
2. Stoch RSI Divs Zone Crypto by Gammaprod
- Teal or Green background.
- The lines is shaping green.
- Better if on the bottom (at a range 20).
3. MACD Volume Crypto by Gammaprod
- Teal or Green background.
- The lines is shaped or shaping green.
- Better if at the green histogram.
B. Bearish
1. Trendlines Boll Ichi Crypto by Gammaprod
- The candles below the purple cloud.
- Lagging span (red line) below the candles.
- then open buy near yellow line (the first option) / white line (the second option) (always confirm the position with two other indicators below).
2. Stoch RSI Divs Zone Crypto by Gammaprod
- Pink or purple background.
- The lines are shaping pink.
- Better if the line on the top (at a range 80).
3. MACD Volume Crypto by Gammaprod
- Pink or purple background.
- The lines are shaped or shaping green.
- Better if at the pink histogram.
C. Consolidation
1. Trendlines Boll Ichi Crypto by Gammaprod
- The candles on the cloud (green or purple).
- Lagging span (red line) on the candles.
- then open buy near the white or blue line (always confirm the position with two other indicators below).
2. Stoch RSI Divs Zone Crypto by Gammaprod
- Mix background specially on a timeframe 15m or more.
- The line move fast up and down.
- Better if on the bottom or the top of the lines (at a range 20 or 80).
3. MACD Volume Crypto by Gammaprod
- Changing the background.
- The line is near the middle line.
- Have small Histogram.
>> The secret ingridient is comparing the timeframe :
The example scalping (Timeframe 1m, 5m and 15m)
- TF 1m is for making an open position.
- TF 5m is for making a judgement of the trend market.
- TF 15m is to confirm that judgement from TF 5m, be careful if it not similar then it used to be a consolidation or the beginning of the reversal.
There's a lot a way to open the position than above information that i gave it to you, but consider there are a limit char on this column, I hope it will help your trading and make a more profit on it.

DaveStratThis script attempts to guess inflection points in cryptocurrency asset prices using change in two simple moving averages on the daily timescale.
MACD of Aggregated Buy/Sell Pressure - InFinitoModified & Updated script from MARKET VOLUME by Ricardo M Arjona @XeL_Arjona that Includes Aggregated Volume
Aggregation code originally from Crypt0rus
***The indicator can be used for any coin/symbol to aggregate volume , but it has to be set up manually***
***The indicator can be used with specific symbol data only by disabling the aggregation option, which allows for it to be used on any symbol***
- Calculated based on Aggregated Volume instead of by symbol volume . Using aggregated data makes it more accurate and allows to compare volume flow between different kinds of markets (Spot, Futures , Perpetuals, Futures+Perpetuals and All Volume ).
- As well, in order to make the data as accurate as possible, the data from each exchange aggregated is normalized to report always in terms of 1 BTC . In case this indicator is used for another symbol, the calculations can be adjusted manually to make it always report data in terms of 1 contract/coin.
Buy to Sell Convergence / Divergence by @XeL_Arjona:
"It's a simple adaptation of the popular "Price Percentage Oscillator" or MACD but taking Buying Pressure against Selling Pressure Averages, so given a Positive oscillator reading (>0) represents Bullish dominant Trend and a Negative reading (<0) a Bearish dominant Trend. Histogram is the diff between RAW Volume Pressures Convergence/Divergence minus Normalized ones (Signal) which helps as a confirmatory."
Things to look for:
- Divergences: This indicator can very useful to spot tops and bottoms through divergences

AC- MY SCRIPT1My Ac- My Scrpt1 that the BUY and SELL signals (trend reversals) for many coins defined different tickers in Tradingview charts
Terminology explanation:
Confirmed Reversal: Oxford T reversal that happened in the last bar and cannot be repainted.
Potential Reversal: Oxford T reversal that might happen in the current bar but can also not happen depending upon the timeframe closing price.
Downtrend: Tickers that are currently in the sell zone
Uptrend: Tickers that are currently in the buy zone
List and show has also got a built in Oxford T indicator which users can confirm the reversals on graphs.
Screener explores the 40 tickers in current graph's time frame and also in desired parameters of the OTT indicator.
Also you can optimize the parameters manually with the built in STRATEGY version.
Built in Moving Average type defaultly set as VAR but users can choose from 8 different Moving Average types like:
SMA : Simple Moving Average
EMA : Exponential Movin Average
WMA : Weighted Moving Average
TMA : Triangular Moving Average
VAR : Variable Index Dynamic Moving Average aka VIDYA
WWMA : Welles Wilder's Moving Average
ZLEMA : Zero Lag Exponential Moving Average
TSF : True Strength Force
Tip: In sideways VAR would be a good choice
You can use OxforfT default alarms and Buy Sell signals like:
1-
BUY when Prices are above OxfordT
SELL when Prices are below OxfordT
2-
BUY when OxfordT support Line crosses over OoxfordT line.
SELL when OxfordT support Line crosses under OxfordT line.
3-
BUY when OxfordT line is Green and makes higher highs.
SELL when OxfordT line is Red and makes lower lows.
IMPORTANT: SCREENER ONLY EXPLORES AND SCREENS FOR THE 2nd SIGNAL TYPE:
BUY when OxfordT support Line crosses over OxfordT line.
SELL when OxfordT support Line crosses under OxfordT line.
TRADING MADE SIMPLEThis indicator shows market structure. The standard method of using Williams Highs and Lows as pivots, is something of an approximation.
What's original here is that we follow rules to confirm Local Highs and Local Lows, and strictly enforce that a Low can only follow a confirmed High and vice-versa.
-- Highs and Lows
To confirm a candle as a Local High, you need a later candle to Close below its Low. To confirm a Local Low, you need a Close above its High.
A Low can only follow a High (after it's been confirmed). You can't go e.g High, High, Low, Low, only High, Low, High, Low.
When price makes Higher Highs and Higher Lows, market structure is said to be bullish. When price makes Lower Lows and Lower Highs, it's bearish.
I've defined the in-between Highs and Lows as "Ranging", meaning, neutral. They could be trend continuation or reversal.
-- Bullish/Bearish Breaks
A Bullish break in market structure is when the Close of the current candle goes higher than the previous confirmed Local High.
A Bearish Break is when the Close of the current candle goes lower than the most recent confirmed Local Low.
I chose to use Close rather than High to reduce edge case weirdness. The breaking candle often ends up being a big one, thus the close of that candle can be a poor entry.
You can get live warnings by setting the alert to Options: Only Once, because during a candle, the current price is taken as the Close.
Breaks are like early warnings of a change in market bias, because you're not waiting for a High or Low to be formed and confirmed.
Buy The Dip / Sell The Rally
Buy The Dip is a label I gave to the first Higher Low in a bullish market structure. Sell The Rally is the first Lower High in a bearish market structure.
These *might* be good buying/selling opportunities, but you still need to do your own analysis to confirm that.
== USAGE ==
The point of knowing market structure is so you don't make bullish bets in a bearish market and vice versa -
or if you do at least you're aware that that's what you're doing, and hopefully have some overwhelmingly good reason to do so.
These are not signals to be traded on their own. You still need a trade thesis. Use with support & resistance and your other favourite indicators.
Works on any market on any timeframe. Be aware that market structure will be different on different timeframes.
IMPORTANT: If you're not seeing what you expect, check your settings and re-read this entire description carefully. Confirming Highs and Lows can get deceptively complex.

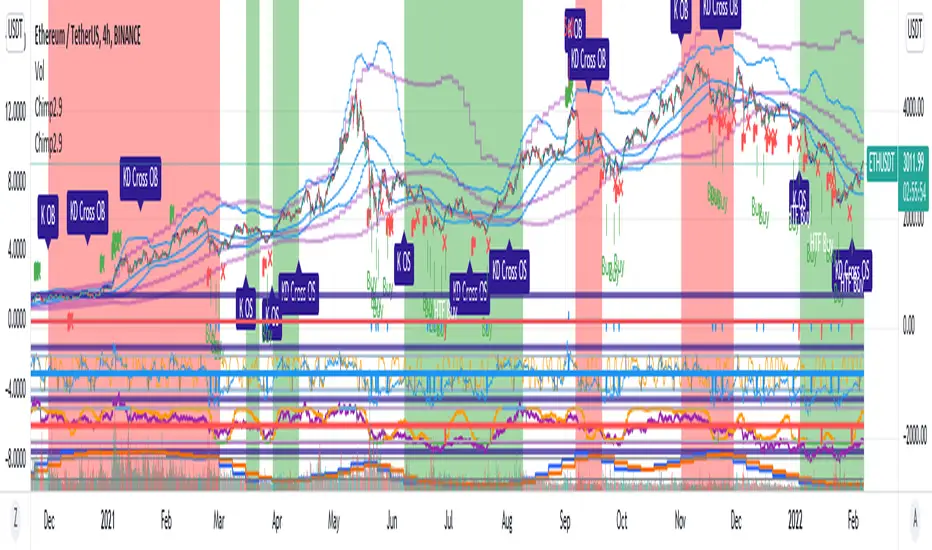
Chimpanzee V2.5 part A by joylay83Hi everyone, I am an amateur pinecoder. I would like to share my script which is coded with the intention of generating signals to send to 3commas webhook. It is still in development and revision.
This collection of indicators use:
Chart: 15m.
Inverse Fisher Transformation of the RSI to detect dips in the 15m timeframe.
Bollinger band (4H) to filter out false signals.
Triple EMA 21: to mimic price action for easier coding alerts. Currently not involved in generating signals. will be incorporated in the future.
StochRSI: As a visual filter. Currently not involved in generating signals. will be incorporated in the future.
Background will be green if stochRSI is low and red if stockRSI is high.
Candlesticks will be marked with a flag is TEMA breached BB.
One would need to play around with timeframes, BB settings and IFTRSI threshold for different signals.
There are 2 Signal Modes (with regards to IFTRSI):
Threshold: When price action falls below BB and IFTRSI hits buy threshold, a buy/sell signal is generated. Eg if IFTRSI buy threshold is set to -0.9, the buy signal will remain continuously positive as long as IFTRSI is < 0.9.
Cross: When price action falls below BB and IFTRSI hits threshold, nothing happens. It will wait until the IFTRSI cross back over the threshold before firing a signal.
There is another identical set of indicators running on a higher time frame (IFTRSI: 4H, BB: D or 3D, TEMA 21 4H) but on the same chart. This tend to generate less signals but are more reliable. A usage example would be to send a larger buy order if the signal comes from this higher time frame, or execute a sell order after multiple buys from the lower time frame.
It comes in 2 parts:
Part A: Contains overlay display. This displays BB, Triple EMA, buy/sell and StochRSI in labels. the labels are self explanatory.
Part B (please search for it): which is actually the same code but contain non-overlay display. You may also put part B overlay=true but scale to LEFT. The advantage of using overlay=true is that you can move the signal right over the candlesticks (mainly for troubleshooting/debugging). This part contains Inverse Fisher RSI, %B, Signal Line. %B is supposedly idential to Bollinger Bands in Part A.
By default, when there is a buy/sell signal:
lower time frame 15m: Signal Line in Part B will turn blue with a value 1 or -1 which corresponds to a buy or sell label in Part A
higher time frame 4H: Signal Line in Part B will turn red with a value 2 or -2 which corresponds to a HTF buy or sell label in Part A
Part A or B may be used to send signal to the webhook. You have to make sure that the settings of Part A and B are identical.
You may choose to un-display some items to reduce clutter.
Current problems:
1. Still too many buy signals
Although many times it will generate excellent buy signal at many swing lows, but there are many buy signals prior to a major swing low. This can be observed in the picture above. It also generate a couple of buy signals prior to the swing lows. I am currently experimenting with 20m and hourly timeframe to address this issue. More filters are needed eg an oscillator or detecting candlestick patterns.
2. Premature sell signals.
The sell signal is often generated at the beginning of a major bull run. My idea to solve this problem is to move to a higher timeframe and sell only when TEMA crossunder the upper bollinger band.
3. Lack of a backtester that can test multiple concurrent deals.
Buy -> Buy (average down) -> Buy (average down) -> Buy (average down) -> Sell
4. Lack of the ability to calculate average purchase price
Probably have to code it as a strategy
5. Display lag
As the browser is running 2 copies of the idential script, it tends to lag when you drag your chart around. So far there are no timeouts or delay in firing alerts to 3commas.
I do welcome any suggestion for improvement and constructive criticism. tqvm.
Credits : Thank you for doing an awesome job. I learnt a lot from your codes and tutorials.
Credits not listed in any order. If your code is used here and did not receive due credit, kindly drop me a note. tq.
Blessing 3 by JTA Today
@ZenAndTheArtOfTrading (extremely-easy-to-understand tutorials eg fixing repainting)
@LazyBear (various codes)
@Galactus-B Argo I
@TheTradingParrot (Inverse Fisher RSI and Gavin's backtester)
@zendog123 (backtester and various codes)
@ydeniz2000 (Bollinger Bands)
TradingView built-in scripts